

Maintenance KPIs (key performance indicators) are the numbers that tell you whether your maintenance program is working — or just keeping busy. The seven most useful ones are MTTR, MTBF, PM compliance rate, downtime hours per asset, planned maintenance percentage, Overall Equipment Effectiveness, and work order backlog. Together they give you a complete picture of reliability, responsiveness, and program discipline.
Why KPIs matter in maintenance
Most plants have two maintenance realities: what people believe is happening, and what the numbers show. A plant manager who believes "our PMs are running well" and a PM compliance rate of 65% are both common — and they coexist easily until there's an audit or a rash of breakdowns in the same month.
KPIs are not a management reporting exercise. They are the feedback loop that tells the maintenance team whether the effort going in is producing the outcomes that matter — fewer breakdowns, faster recovery, less unplanned downtime — or whether the program is producing motion that looks like work but is not moving the right things.
The seven below divide into two categories worth keeping separate.
Lagging indicators (tell you what happened): MTTR, MTBF, OEE, downtime hours. These are the outcomes — they measure what your equipment actually did.
Leading indicators (predict what is about to happen): PM compliance, planned maintenance percentage, work order backlog. These measure the program — whether you are taking the actions that prevent bad lagging indicators.
A plant that only watches lagging indicators is reactive by definition: the number gets bad, then you act. Leading indicators let you see trouble coming and act before the number breaks.
Still calculating MTTR and MTBF by hand in a spreadsheet?
See automatic KPI trackingThe 7 maintenance KPIs
1. MTTR — Mean Time To Repair
What it is: the average time from when a breakdown starts to when the machine is back running. Calculated as total repair time divided by number of breakdowns, over a given period and asset.
What it tells you: how responsive and capable your maintenance team is when failures happen. A falling MTTR means faster diagnosis, better spare-parts availability, and more experienced technicians. A rising MTTR is a warning — something in the response chain is getting slower.
The honest caveat: MTTR only measures recovery speed, not failure frequency. A machine with excellent MTTR (fast repairs) but high breakdown frequency is a machine that needs a PM program, not more technicians on standby.
How a CMMS moves it: MTTR falls when work orders carry the breakdown history, spare-parts used, and root-cause data from every previous failure. That history means technicians arrive at the second breakdown with context, not a blank sheet.
MachDatum computes MTTR automatically per asset and per team from work-order close data — no manual calculation.
For the full form, the formula, and a worked factory example that decomposes MTTR into detection, response, diagnosis, and parts-wait time, see the MTTR in maintenance guide.
2. MTBF — Mean Time Between Failures
What it is: the average time a machine runs between one breakdown and the next. Calculated as total running time divided by number of failures in a period.
What it tells you: how reliable the machine actually is. A rising MTBF means the machine is failing less often — the goal of a preventive maintenance program. A falling MTBF is a signal to look at the PM schedule, parts quality, or operating conditions on that asset.
Lagging, but diagnostic: MTBF tells you what happened. But tracked over time per machine, it becomes a leading signal: a machine whose MTBF has been steadily falling for three months is telling you something before the catastrophic stop.
The honest caveat: MTBF is meaningful only if breakdowns are recorded consistently. A plant that stops recording small stops ("we got it running in 20 minutes so we didn't log it") will see an MTBF that looks better than reality.
MachDatum computes MTBF per asset from work-order history. No separate tracking sheet needed.
For the formula, three worked examples across different machines, and what a falling MTBF is telling you, see the MTBF for machines guide. To see how the two metrics diagnose different problems when read together, see MTTR vs MTBF.
3. PM compliance rate
What it is: the percentage of scheduled preventive maintenance tasks completed within their due window. If 40 PMs were scheduled this month and 32 were completed on time, PM compliance is 80%.
What it tells you: whether your preventive maintenance program is actually running. This is the most important leading indicator in this list — PM compliance predicts MTBF and downtime several weeks out. A PM compliance rate below 80% is a program that exists on paper but is not happening on the floor.
The honest caveat: there is a PM compliance rate that lies. A team that marks every PM complete without fully executing the checklist will show 100% compliance and steadily worsening MTBF. The rate is meaningful only when the checklist steps are being captured — not just the open/close timestamps.
The most common version of this: a technician marks the PM closed without visiting the machine. No photos, no checkpoint entries — just the close timestamp. The work did not happen. The fix is not more auditing from a desk. It is capturing the evidence inside the PM itself — mandatory checkpoint fields, photo capture against specific steps, completion signed off on the mobile app at the machine. When the proof lives inside the work order, the inflation stops because there is nothing to fake without the actual visit.
Targets: above 90% is a functioning program. Above 95% on your critical A-class assets is worth aiming for; below 80% means you have more PMs scheduled than your team can execute (reduce the plan before it degrades further, not after).
MachDatum's PM auto-dispatch creates the work orders automatically and tracks completion against the schedule. Overdue PMs surface immediately in the PM list without anyone having to chase a spreadsheet.
MaintainX
The gap between a PM marked complete and a PM actually executed is where compliance rates quietly lose their meaning. Closing that gap is a workflow problem, not a reporting one: the evidence has to be captured at the machine, by the person doing the work, in the moment.
MaintainX is built around that idea. Technicians open the work order on their phone at the asset, step through mandatory checkpoints, capture photos against specific procedure steps, log parts used, and sign off on completion before the record closes. MaintainX AI can turn OEM manuals and voice notes into structured digital procedures, so the checklist matches the actual job rather than a generic template. When the proof lives inside the work order, PM compliance stops drifting away from MTBF, and the KPIs on the dashboard reflect what happened on the floor.
The MaintainX mention in this article is a paid partnership.
4. Downtime hours per asset
What it is: the total hours each machine spent stopped due to unplanned failures, in a given period (week, month, quarter).
What it tells you: the raw scale of the reliability problem, per machine. This is the number a production manager and a maintenance manager can agree on — it is not an efficiency ratio or an average, it is just time lost. One machine accounts for 68 of 120 monthly downtime hours: now everyone agrees where to focus.
How to use it: rank your assets by downtime hours and work from the top. This sounds obvious; it is not universal. Many plants focus their best maintenance attention on their newest machines or their most expensive machines, not the ones actually causing the most production loss. Convert the top asset's downtime hours to a production loss figure — that number, not a benchmark ratio, is what gets a PM program funded.
MachDatum computes downtime hours per asset automatically from work-order records (downtime captured as a mandatory field at job close).
5. Planned maintenance percentage (PMP)
What it is: the percentage of total maintenance work that was planned (preventive, scheduled, condition-based) rather than reactive (breakdown response). Calculated as planned work orders ÷ total work orders.
What it tells you: how mature your maintenance program is. A plant running 20% PMP — four out of five jobs are reactive firefighting — has a maintenance program in name only. A plant at 70–80% PMP has reached the level where maintenance is mostly a scheduled activity, and breakdowns are the exception.
Industry framing: the target for a functioning program is typically above 70% planned work. Below 50% is essentially reactive maintenance, regardless of what the PM schedule says on paper.
Why this matters for MTTR: reactive maintenance is inherently slower than planned maintenance. A breakdown at 2 am on a Saturday finds technicians without spares, without context, and without a procedure. A scheduled job at 7 am Tuesday has spares kitted, a checklist prepped, and an experienced technician assigned. The same physical work takes less time and produces a better outcome when planned.
Work order types in MachDatum distinguish breakdown responses from scheduled PM and condition-based work — PMP is derivable from your work-order history.
6. OEE — Overall Equipment Effectiveness
What it is: OEE = Availability × Performance × Quality. A single percentage that measures how much of planned production time was truly productive — good parts, at full speed, with no stops.
What it tells you: the combined effect of availability (maintenance's domain), performance (operations), and quality (quality/engineering). For a full explanation with a worked calculation example, see our guide to OEE in manufacturing.
One critical note: OEE is not a maintenance KPI — it is an equipment KPI that maintenance contributes to through the availability factor. Including it in a maintenance dashboard is useful precisely because it shows the production impact of maintenance decisions. But chasing the OEE headline without decomposing it into Availability/Performance/Quality leads to the wrong interventions.
MachDatum does not compute OEE (that requires machine-speed and quality data from the production system). What it computes is the availability component: MTTR, MTBF, and downtime per machine. For most plants, availability is where the biggest OEE losses sit.
7. Work order backlog
What it is: the number of open, overdue, or unassigned work orders at any point in time. More precisely: work that has been identified, logged, but not yet done.
What it tells you: the gap between demand on your maintenance team and their capacity to execute. A growing backlog is a leading indicator — it means the team is not keeping up, which means PM slippage is coming, which means MTBF deterioration is coming, several weeks later.
What it does not tell you by itself: a backlog of 40 work orders might mean the team is overloaded, or it might mean 35 of those are low-priority jobs being consciously deferred. Backlog analysis is useful when broken down by priority and by age — a large backlog of low-priority jobs is manageable; a growing backlog of critical-asset jobs is not.
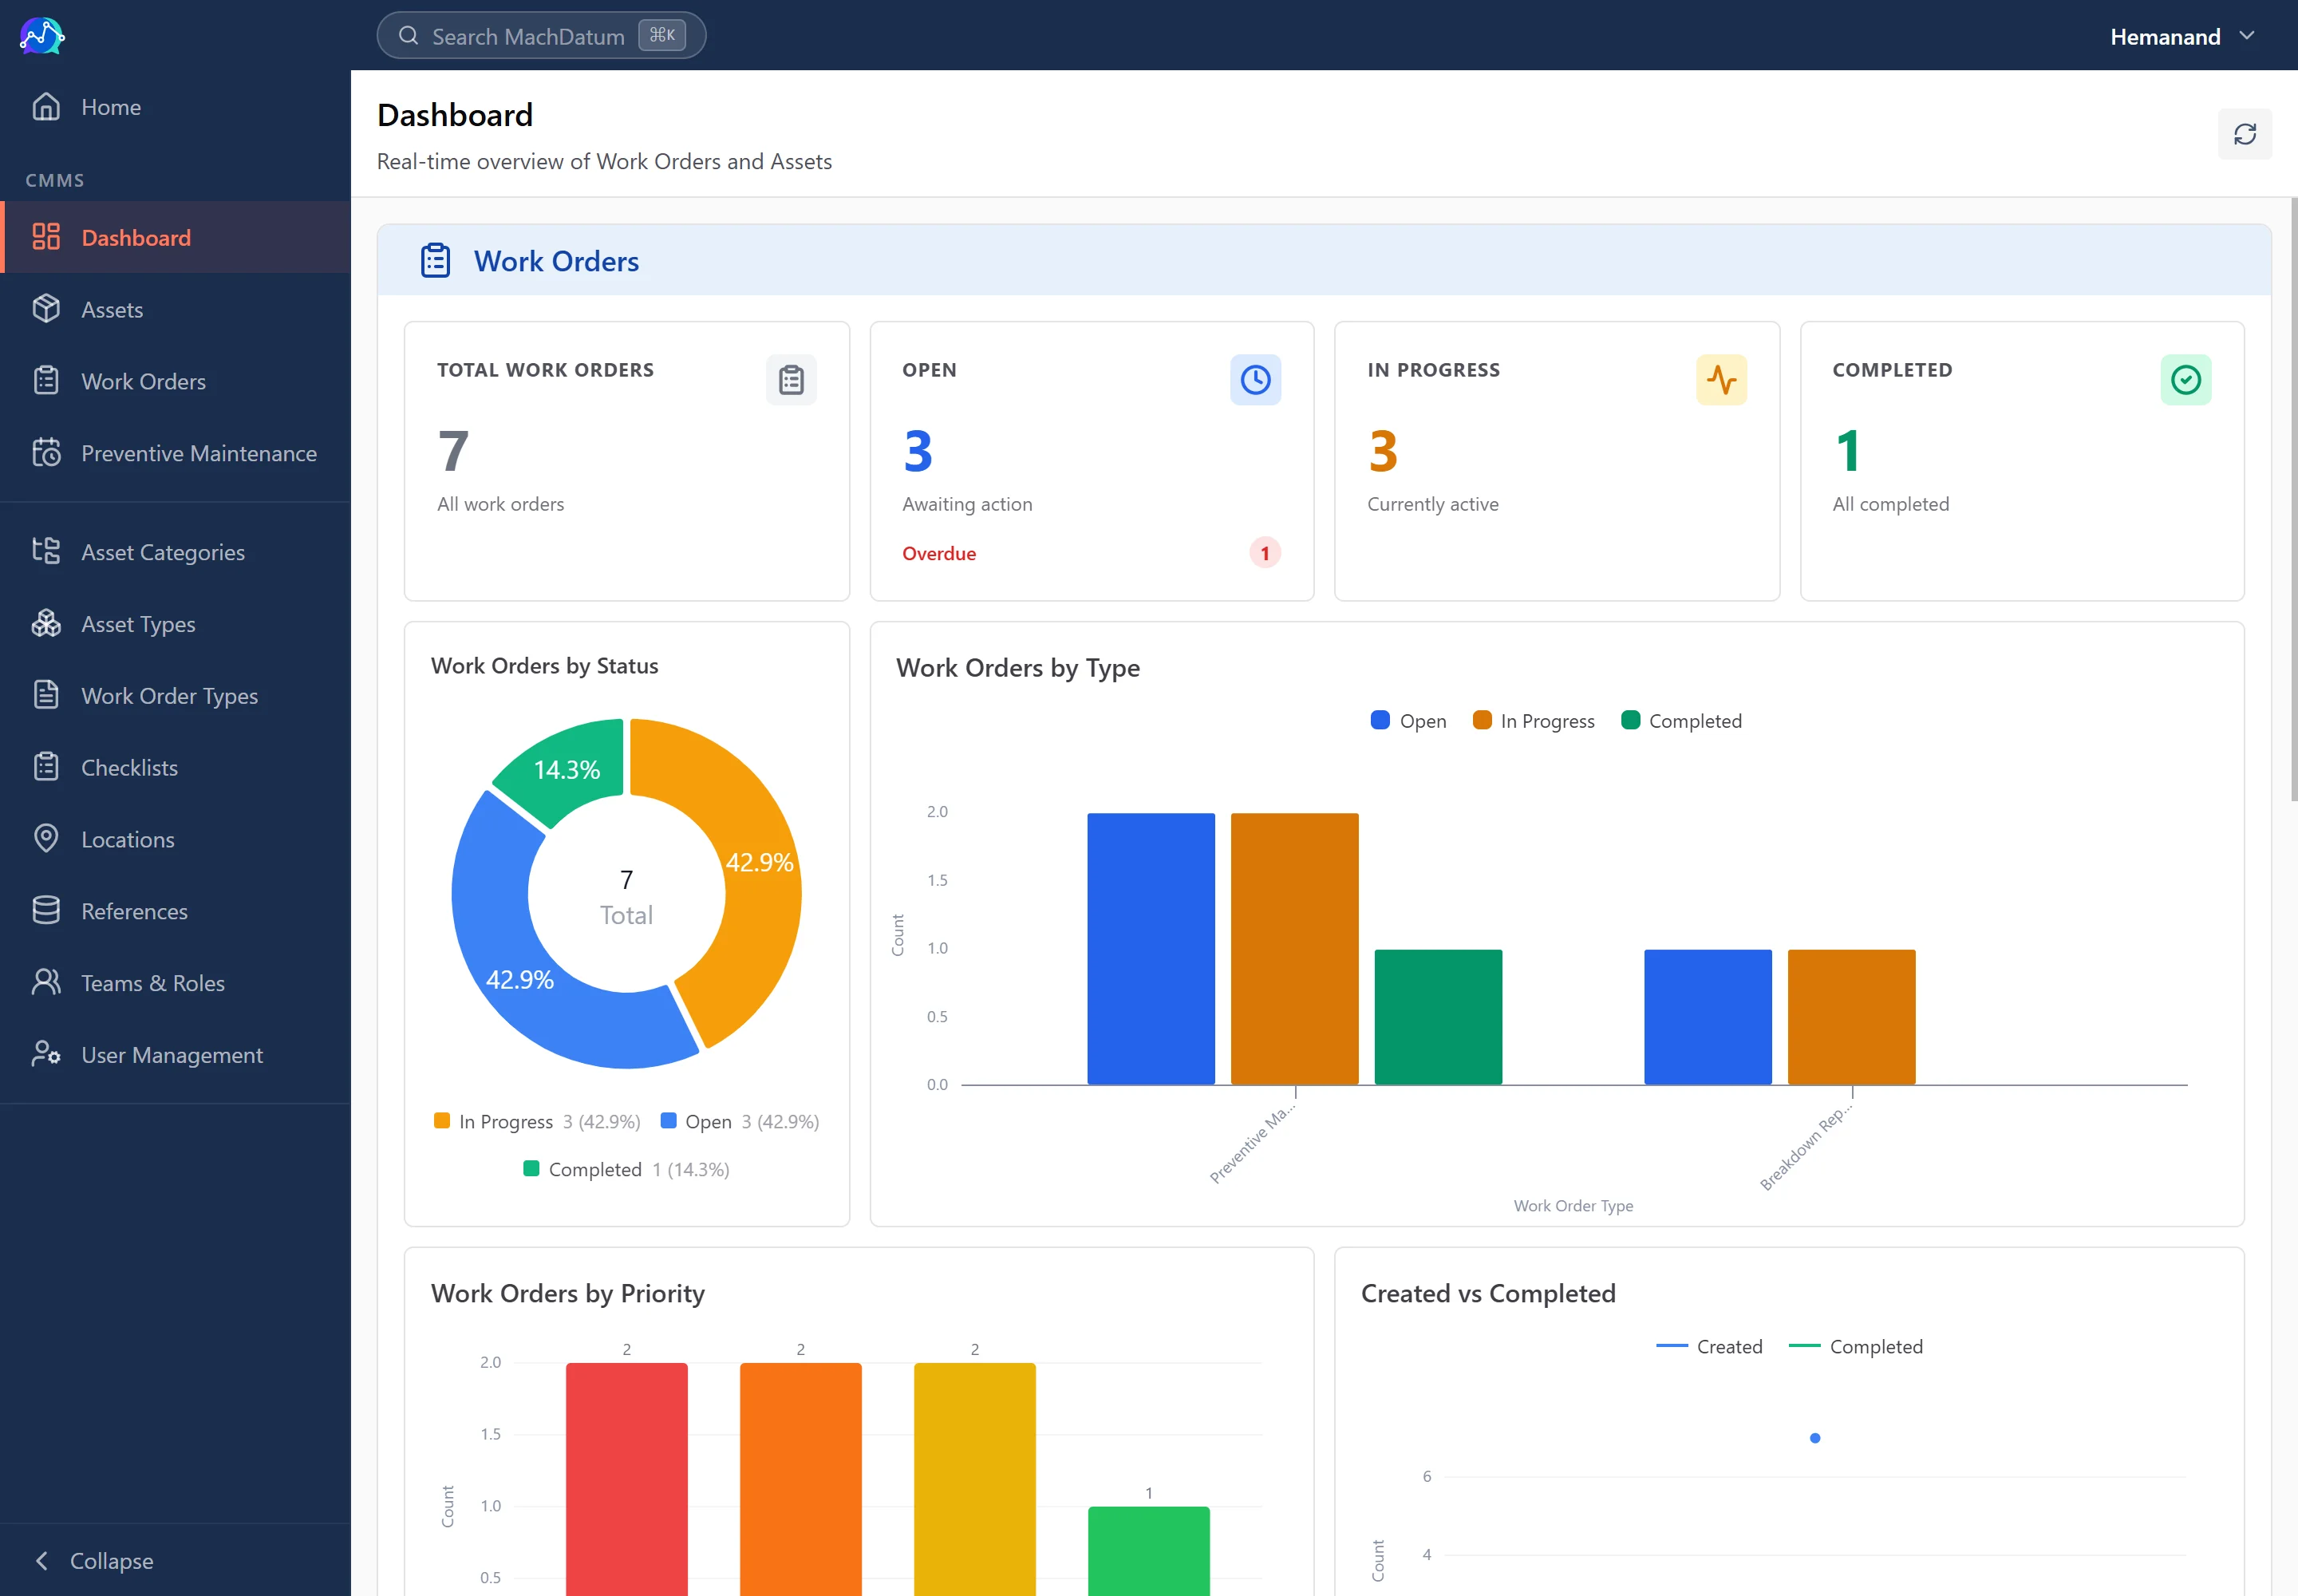
The MachDatum dashboard shows open and overdue work orders per team, per asset, and per assignee. Escalation rules surface overdue jobs automatically to the plant manager without anyone needing to chase a status report.
Maintenance KPIs in ISO 22400
Everything above is how these metrics get used on a factory floor. There is also a formal definition of them: ISO 22400 — Automation systems and integration — Key performance indicators (KPIs) for manufacturing operations management. Part 2, Definitions and descriptions, is where MTBF, MTTR and the rest are specified.
It is worth more than a passing standards reference, because ISO 22400-2 is precise about the thing most maintenance teams are vague about: which time actually counts.
What the standard covers
ISO 22400-2 specifies KPIs residing at Level 3 of the equipment hierarchy adapted from IEC 62264-3 — the manufacturing operations management (MOM) layer, the layer an MES or a CMMS sits in. It deliberately uses generic terms — work unit, work centre — instead of industry-specific ones, so the same definitions apply to a CNC cell, a packaging line, and a furnace.
MOM covers four categories of operations, and maintenance is one of them:
- production operations management
- maintenance operations management
- quality operations management
- inventory operations management
The six maintenance time elements
Before ISO 22400-2 defines a single KPI, it defines the raw time elements those KPIs are computed from. Clause 5.1.4, Maintenance times, lists six:
| Element | How ISO 22400-2 defines it |
|---|---|
| TBF — time between failures | The actual unit busy time between two consecutive failures of a work unit, including setup time, production time and repair time related to the orders being processed — and without delay times |
| TTR — time to repair | The actual time during which a work unit is unavailable due to a failure |
| TTF — time to failure | The time between failures minus the time to repair |
| FE — failure event count | The count, over a specified time interval, of the terminations of the ability of a work unit to perform a required operation |
| CMT — corrective maintenance time | The part of maintenance time during which corrective maintenance is performed on a work unit, including the technical and logistic delays inherent in it |
| PMT — preventive maintenance time | The part of maintenance time during which preventive maintenance is performed on a work unit, including the technical and logistic delays inherent in it |
Why the distinction is the useful part
Notice what the standard separates: TBF is a time element. MTBF is the KPI. The KPI is the mean of that element over an observation period — and the same relationship holds for TTR and MTTR, TTF and MTTF.
That reads as pedantry until two plants compare MTBF figures and find they disagree by a third. The usual reason is that they counted different time. The standard's TBF is busy time — setup, production and repair against live orders — and it explicitly excludes delay times. A plant computing "MTBF" from wall-clock calendar time between failures, weekends and idle shifts and waiting-for-parts included, is measuring a different quantity and giving it the same name.
The practical rule that falls out of this: decide what counts as running time, write the definition down, and apply it identically every period. An MTBF that is internally consistent and trending in the right direction is worth more than one that matches somebody else's arithmetic.
The same trap sits inside FE. "Termination of the ability to perform a required operation" includes the twenty-minute stop the operator cleared without calling anyone. A plant that logs only the failures a technician attended will report a flattering MTBF — the caveat in the MTBF section above, restated by the standard as a definitional question rather than a discipline one.
On sourcing: the six definitions above are from clause 5.1.4 of ISO 22400-2:2014. The normative KPI formulas themselves sit in clause 6, Description of KPIs, which is not in the public preview of the standard. If you need those formulas for an audit or to answer a customer specification, buy ISO 22400-2 from ISO — do not take them from a blog, this one included.
Which KPIs to start with
Seven numbers is too many to introduce at once on a plant that currently tracks none of them. The recommended starting four are:
- MTBF — baseline reliability, per critical machine
- MTTR — baseline response speed, same machines
- PM compliance rate — is your program actually running?
- Downtime hours per asset — where is the biggest loss?
These four give you the full picture in the smallest number of metrics: what is failing (MTBF), how fast you recover (MTTR), whether your prevention is working (PM compliance), and where to focus (downtime ranking). The other three — OEE, PMP, backlog — add context once the first four are established.
The reason seven is too many at the start is not that the numbers are wrong — it is that watching too many metrics at once makes every action uncertain. Here is the pattern that plays out: a plant introduces more PMs to reduce breakdowns. MTBF starts climbing — the program is working. But PM compliance drops, because the team now has more scheduled tasks than they have absorbed. A manager watching both numbers sees one improving and one degrading, does not know which signal to trust, and pulls back on PMs to get compliance up. MTBF starts falling again. The conclusion: "PMs didn't work." The program was working. The conflicting metrics killed the response. Start with four, understand how they move together, and add the others once the causal relationships are clear.
The trap to avoid: measuring KPIs without a feedback loop. Log MTBF and MTTR per machine, review them monthly, and use them to prioritize your PM schedule and your improvement work. Numbers that are tracked but not acted on are a form of overhead.
Where MachDatum fits: MTTR, MTBF, downtime per asset, PM compliance, and work order backlog are all computed automatically from your work-order and PM data — no spreadsheet, no separate calculation. The analytics view updates with every closed work order, and overdue PMs surface in the dashboard without anyone chasing them. We're onboarding our first group of manufacturing teams right now — see the analytics and dashboard at machdatum.com.