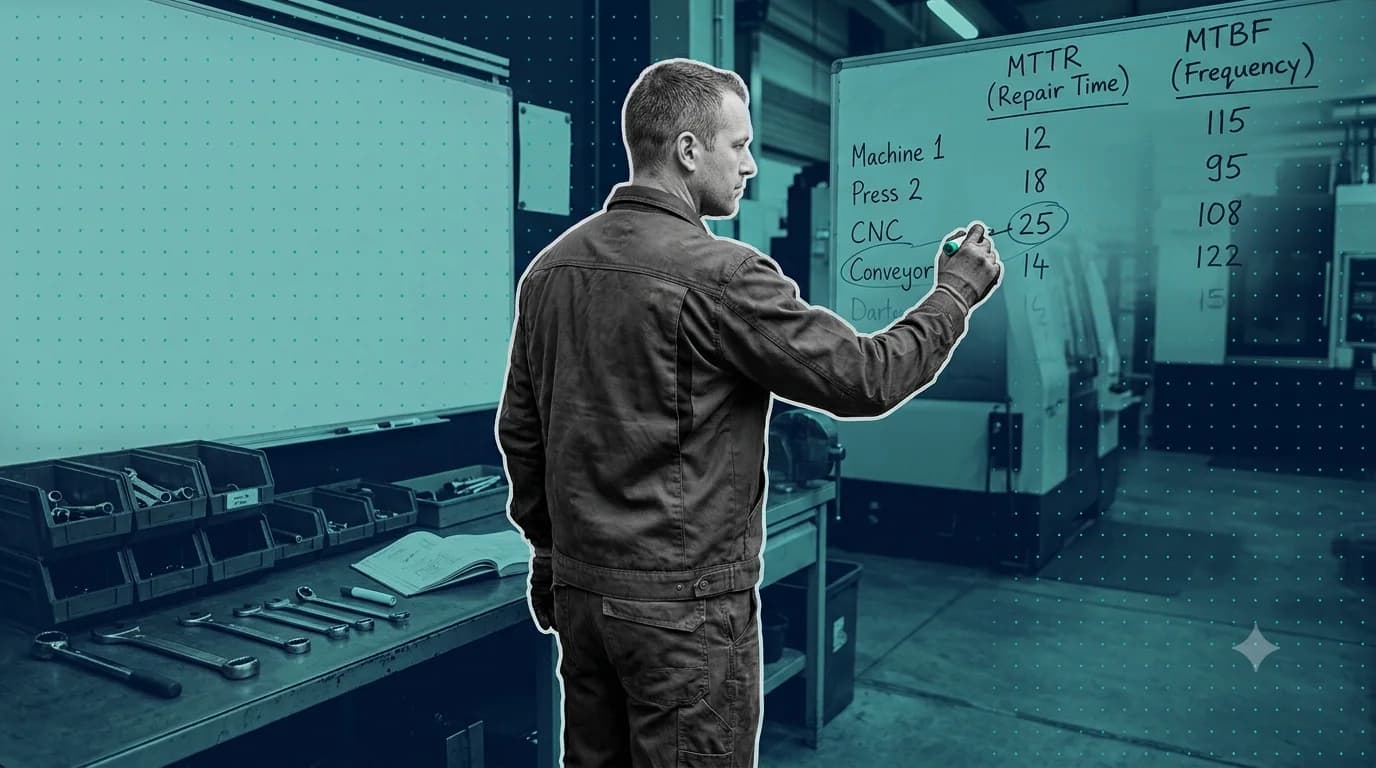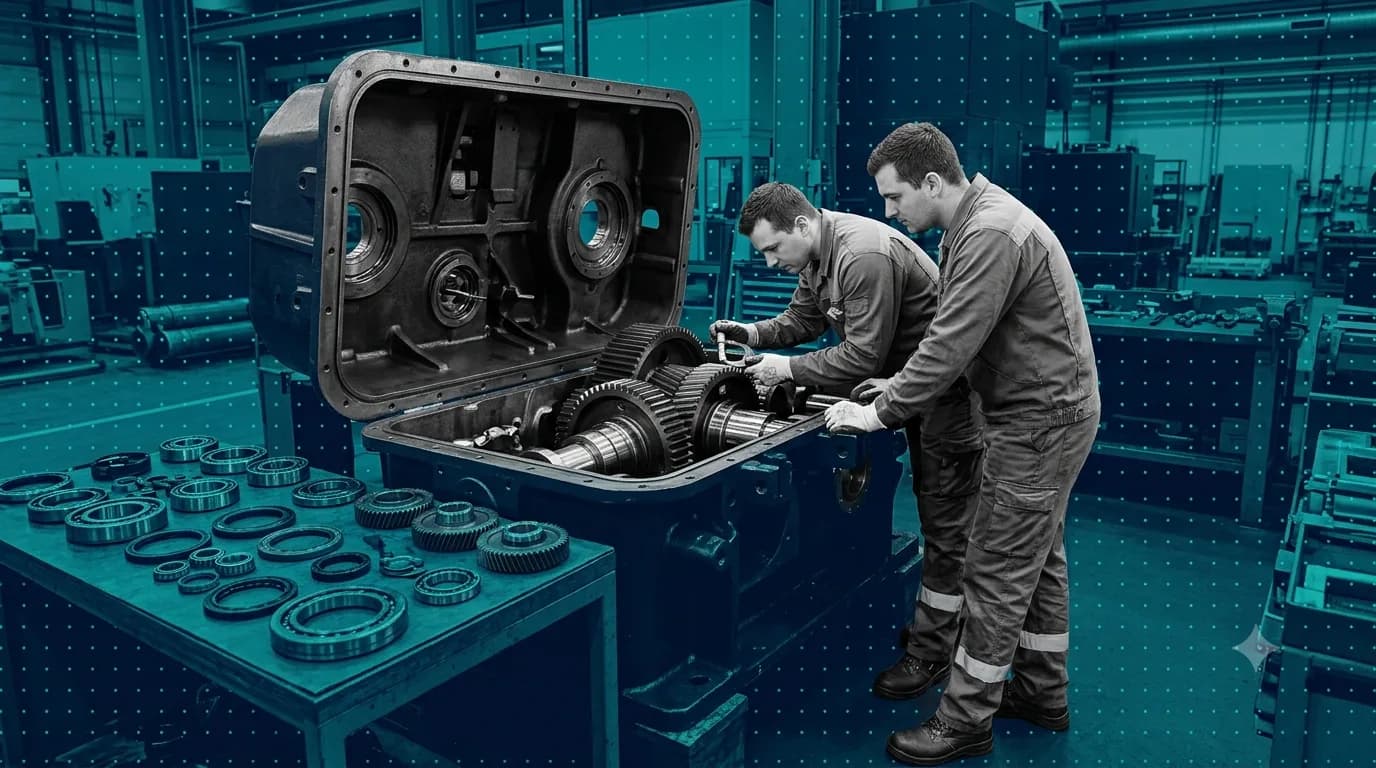




MTTR stands for Mean Time To Repair — the average time it takes to restore a machine to working condition after a breakdown, measured from the moment the failure is detected to the moment the machine is back in production. It is one of the two core maintenance metrics; the other is MTBF (Mean Time Between Failures). Already have your repair time and breakdown count? Use the MTTR calculator to get the number directly.
Most articles you will find on MTTR are written for IT teams: mean time to repair a server, resolve an incident ticket, or roll back a failed deployment. This page is not that. MTTR as a maintenance metric lives on the factory floor — it is about machines stopping, technicians arriving, parts being found (or not found), and machines restarting. The context is entirely different, and so are the levers for improving it.
MTTR full form and definition
MTTR stands for Mean Time To Repair. In a manufacturing context, it is the average elapsed time between a machine stopping due to an unplanned failure and that machine being returned to production — fully repaired, tested, and handed over.
A few things are worth being precise about up front.
"Mean" means average. MTTR for a machine or fleet is calculated across multiple breakdowns over a defined period — not from a single repair. One repair gives you a data point. A month of repairs gives you a meaningful metric.
"Time To Repair" means the total elapsed clock time, not just the hands-on repair work. It starts the moment the machine stops (or the fault is detected), and ends when the machine is back running in production. Everything in between — diagnosis, waiting for spares, the actual repair, testing — is counted. This is important because it means a high MTTR might have nothing to do with how fast your technicians work.
What MTTR is not: a measure of how slow your maintenance team is. It is a measure of the total system response to a breakdown — maintenance team, spare parts inventory, documentation quality, shift communication, and escalation speed combined.
MTTR is one of the two foundational maintenance metrics. The other is MTBF — Mean Time Between Failures — which measures how frequently a machine breaks down. You need both: a machine with low MTBF breaks down often; a machine with high MTTR is out of production for a long time when it does. The MTBF guide and MTTR vs MTBF comparison cover that relationship in detail. For a full view of how MTTR fits into a maintenance KPI framework, see the maintenance KPIs guide.
The MTTR formula
MTTR = Total repair time ÷ Number of breakdowns (in a given period, for a given asset or fleet)
That is the complete formula. There are no coefficients, no weighting factors, no adjustments. The complexity is not in the equation — it is in knowing what counts as repair time and what period to measure over.
What counts as repair time
Repair time is the total elapsed time from breakdown detection (or production stop, whichever is recorded first) to machine back in production. It includes:
- Fault detection time — the gap between when the fault occurred and when it was noticed. On a well-monitored line this is near-zero. On an unmanned line running overnight it can be hours.
- Response time — how long it takes for a technician to arrive at the machine after the fault is reported.
- Diagnosis time — how long it takes to identify the root cause of the failure. Varies widely depending on the technician's familiarity with the machine and whether any previous fault history is available.
- Parts wait time — how long the job sits waiting for a spare part that is not in stock, or whose location in the stores nobody knows. This is frequently the largest single component of MTTR in plants that haven't addressed spares strategy deliberately.
- Repair time — the actual hands-on work: disassembly, replacement, reassembly.
- Testing and handover — running the machine to confirm the repair holds, getting sign-off from the operator or production supervisor.
What repair time does not include: planned changeovers, scheduled maintenance windows, shift meal breaks where the machine was already idle. Those are different events with different records. Mixing them into your MTTR figure produces a metric that is impossible to act on.
What period to use
Calculate MTTR monthly or quarterly, per asset (or per asset class if a single asset has too few breakdowns for a meaningful average). Do not calculate MTTR from a single incident — one repair is a data point, not a metric. Do not use a rolling annual figure as your primary view — it smooths out seasonal trends and hides deterioration that is happening right now.
Monthly MTTR per asset is the standard starting point for most maintenance teams.
Worked factory example — calculating MTTR
A packaging machine in a food plant had five breakdowns in one month. Here is the breakdown log:
| Breakdown | Machine stopped | Machine back up | Repair time |
|---|---|---|---|
| 1 | Mon 07:45 | Mon 09:15 | 1 hr 30 min |
| 2 | Thu 14:20 | Thu 16:50 | 2 hr 30 min |
| 3 | Mon 11:00 | Tue 08:30 | 21 hr 30 min (awaiting spares overnight) |
| 4 | Wed 22:00 | Thu 00:45 | 2 hr 45 min |
| 5 | Fri 08:30 | Fri 11:00 | 2 hr 30 min |
| Total | 30 hr 45 min |
MTTR = 30h 45m ÷ 5 = 6 hours 9 minutes
Now look at breakdown 3 before drawing any conclusions from that number.
Breakdown 3 was a bearing failure on Monday morning. The technician diagnosed it within 45 minutes, confirmed the correct replacement bearing, went to stores, and found none in stock. The bearing had to be sourced from a local supplier — it arrived the following morning. The machine was back up by 08:30 Tuesday. Total elapsed time: 21 hours 30 minutes, of which approximately 20 hours was waiting for a part.
The MTTR of 6 hours 9 minutes looks like a slow maintenance team. It is not. It is an inventory problem. The technicians' actual repair work on all five breakdowns totaled roughly 9–10 hours. The other 20+ hours were a stocking decision.
This is the most important thing to understand about MTTR: the number alone tells you that something is slow. The breakdown tells you what is slow. Until you decompose the figure, you cannot fix the right thing.
What MTTR actually measures — and what it hides
MTTR is a summary metric. It compresses several different problems into a single number, and that compression hides the diagnosis.
Here are the components again, and what a high reading in each one means:
High detection time means the machine ran failed for a period before anyone noticed — a shift-handover gap, an unmanned zone, no monitoring on that asset. The fix is operational (monitoring, shift checks) not mechanical.
High response time means the technician took a long time to arrive after the fault was reported. This is a resourcing or prioritization problem — not enough technicians on shift, or the breakdown was not treated as urgent.
High diagnosis time means the technician had to work out the fault without reference to previous history. The same bearing failing in the same machine for the third time should take 10 minutes to diagnose — it has a documented fault history, a known repair procedure, and a known parts list. If it takes 3 hours every time, the fault history is not being recorded or accessed.
High parts wait time means the spares strategy for that machine does not match its failure modes. The bearing that caused 20 hours of downtime in the worked example above costs under $100 to stock. The cost of not stocking it was one lost production day.
High actual repair time means the physical work is slow — unfamiliarity with the machine, incorrect tools, or a genuinely complex repair that takes time regardless.
High testing and handover time is usually short but occasionally significant — complex machinery that requires a full run-up cycle, or production processes where handover requires quality sign-off before the line can run.
Most maintenance teams track MTTR as a single number and try to "improve MTTR" as if it were one thing. The real improvement comes from understanding which phase is driving the number. In the worked example, no amount of technician training would have helped. The bearing needed to be in stock.
We saw this firsthand on an early industrial IoT deployment — a field device failed, and it sat offline for far longer than the actual fix required, simply because the replacement part wasn't on hand and had to be sourced after the failure, not before it.
What moves MTTR down
These are practical interventions, not principles. Each one targets a specific phase of the MTTR breakdown.
Spare parts availability for your critical machines
Identify your top five assets by breakdown frequency or by downtime cost. For each of those machines, map out the parts that fail most often — the seals, bearings, belts, fuses, solenoid valves. Parts wait time accounts for 40–60% of total MTTR in many plants that have not addressed this deliberately. Stocking one or two units of each critical wear part for a high-frequency machine is an inventory decision that typically pays back in the first breakdown.
Availability is not just stocking — it is also location. A bearing that is on a shelf somewhere in a large stores room, with no bin location recorded, can add an hour to a repair as someone searches. The part needs to be stocked, binned, and findable.
Fault history accessible at the machine
A technician arriving at a machine that has failed the same way before should see the previous diagnosis, the repair steps taken, and the parts used — before they start working. This is not a luxury. It is the difference between a 20-minute diagnosis and a 3-hour one.
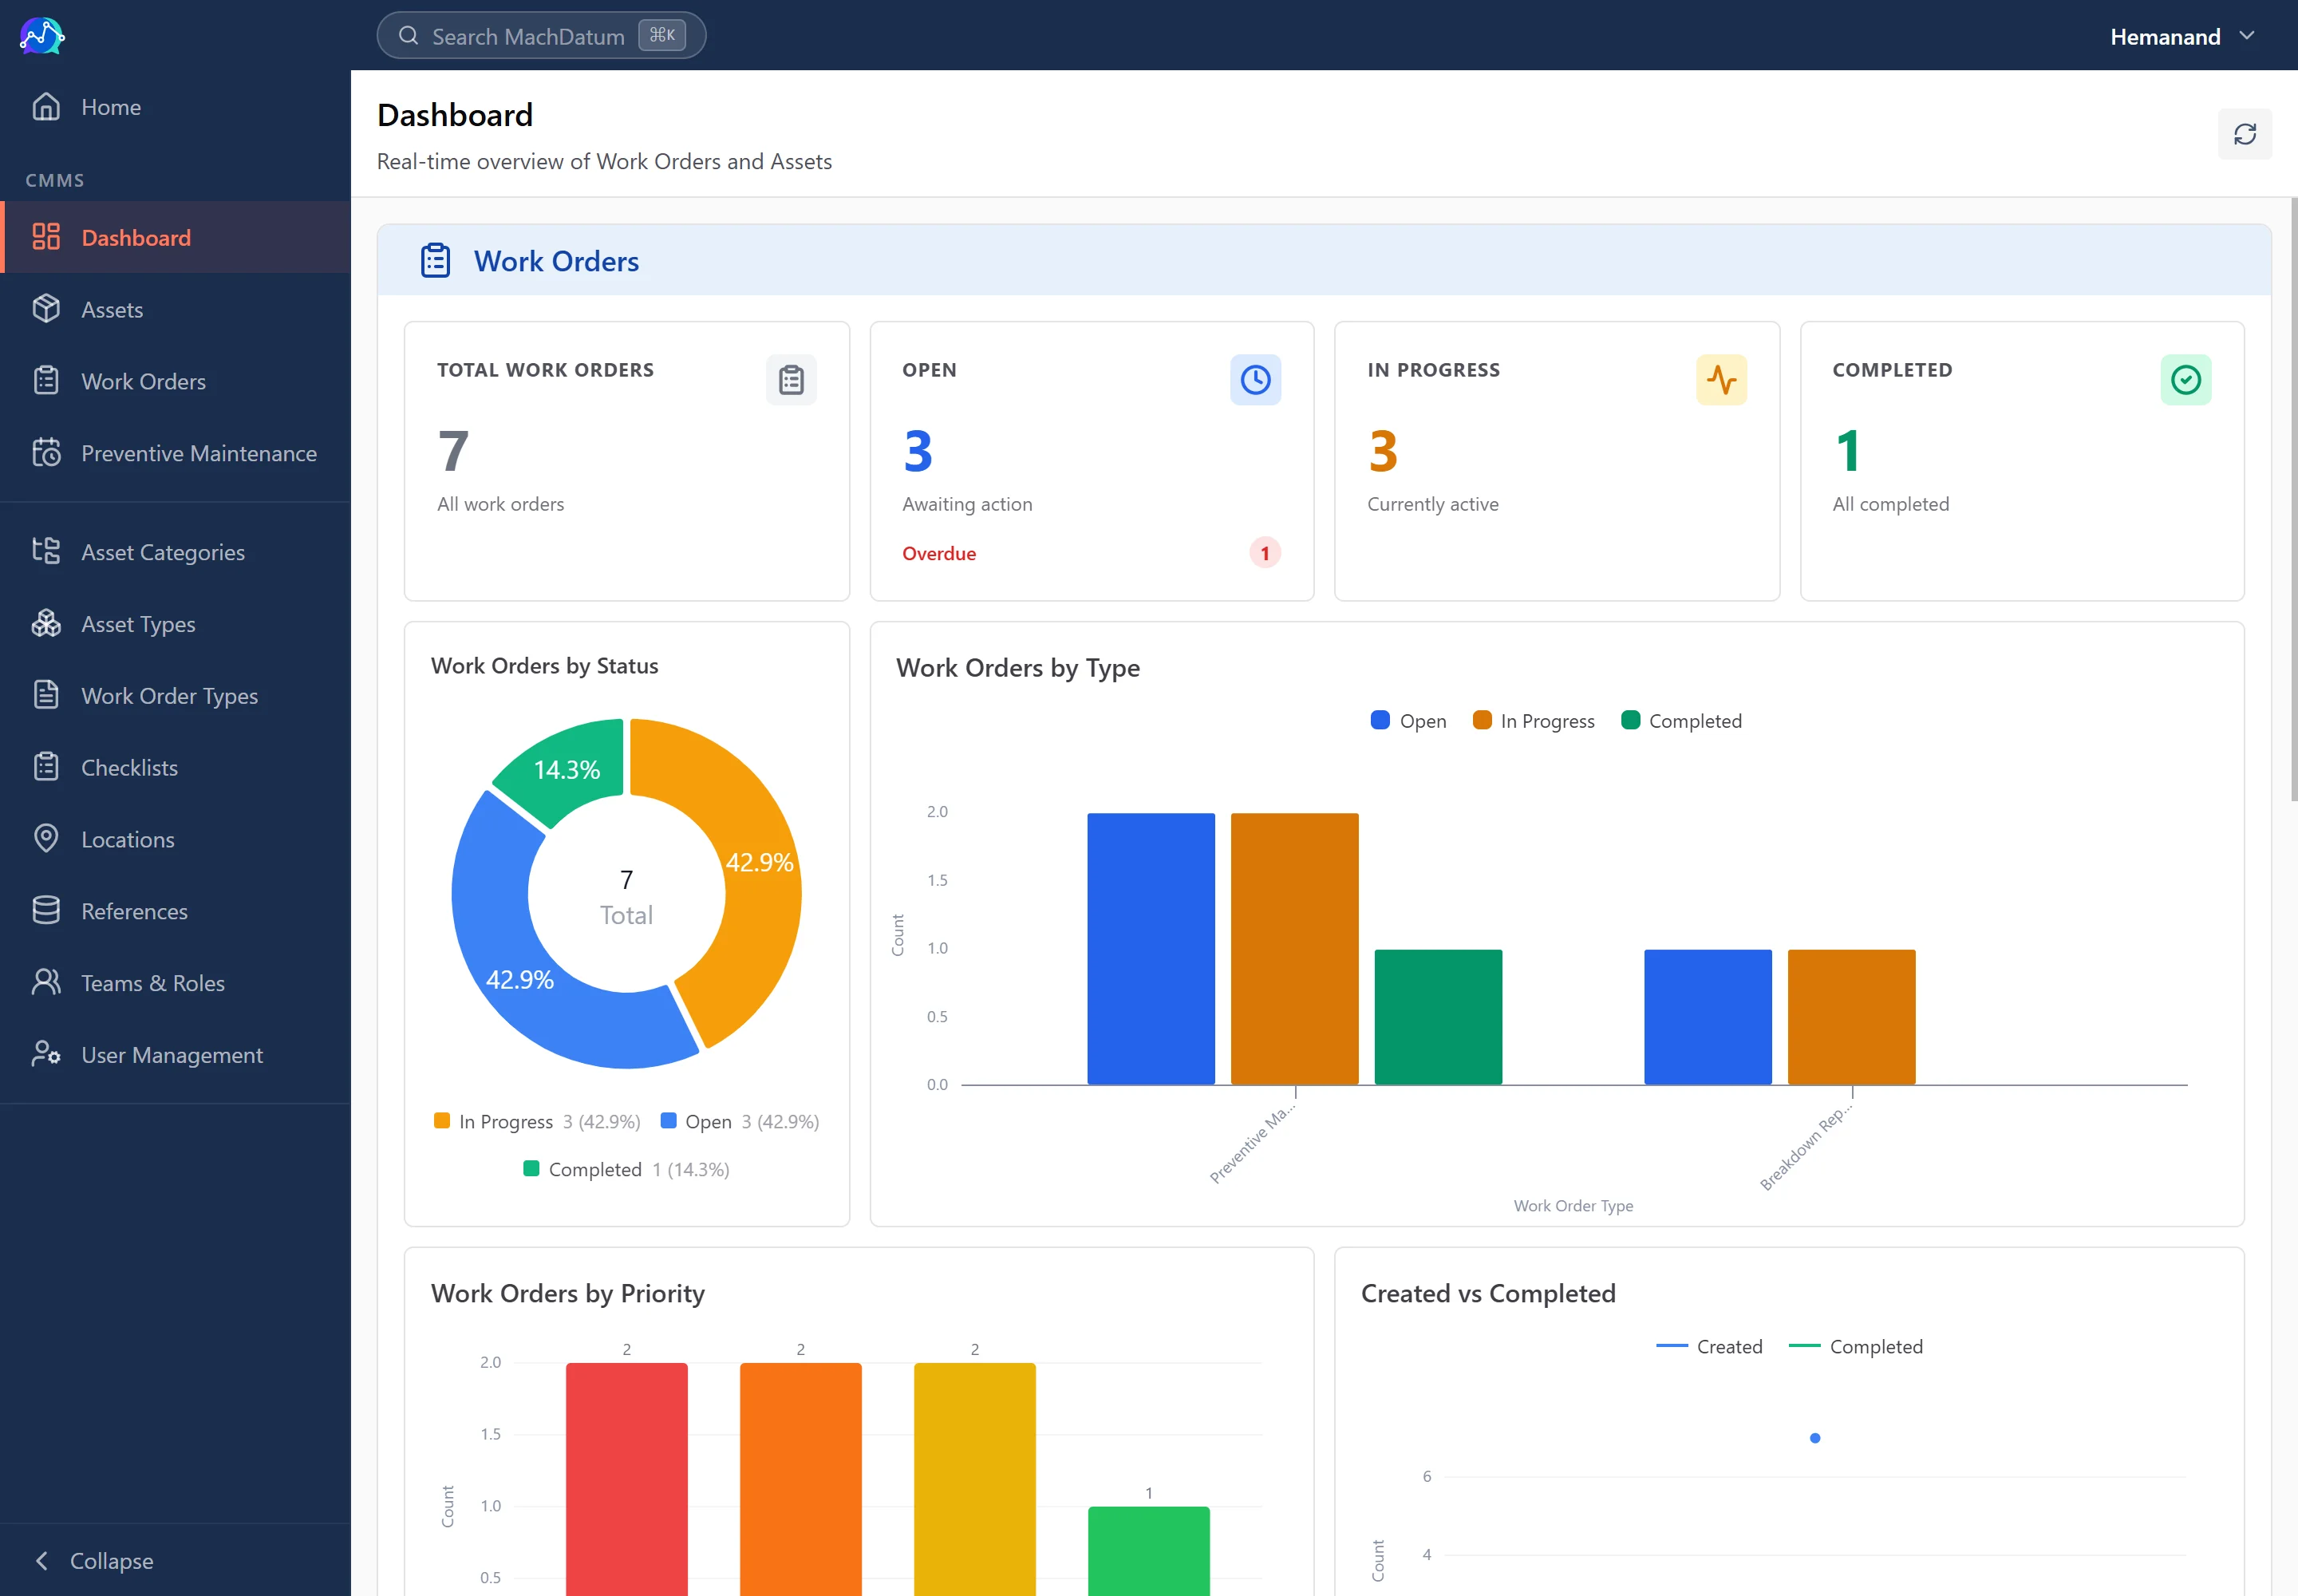
In a plant that records maintenance on paper job cards, this information exists (sometimes), but accessing it means physically retrieving the card from a file — assuming it was filed, assuming it was legible, assuming the technician knows to look. In a CMMS, the asset's fault history is attached to the work order the moment it is raised. The technician reads what happened last time before opening a panel.
Root-cause capture that turns into preventive action
If breakdown 3 in the worked example above was recorded as "bearing seized — root cause: never lubricated (PM missed)" and the corrective action was "add bearing lubrication to monthly PM checklist," then breakdown 3 should not recur. MTTR data only drives improvement when the root causes captured in it turn into changes to the PM program.
This requires two things: root cause to be captured at every repair (not optional, not skipped when the technician is in a hurry), and someone to review those root causes and create corrective actions. A CMMS makes root-cause capture mandatory at repair closure. The review is a management habit.
Escalation speed
Does the maintenance manager know a machine has been down for two hours? Or do they find out at the morning meeting? In most plants without a formal system, it is the latter — the manager's first visibility into a long breakdown is the shift handover note or a direct call. By that point, a bearing-wait scenario has already lost a production shift.
Automatic escalation — where a work order that has been open past a threshold triggers a notification — means the plant manager can intervene (authorize an emergency courier, call the supplier, release a technician from another job) while there is still time to reduce the downtime, not just record it.
Reducing breakdown frequency itself
This is adjacent to MTTR rather than a component of it, but it belongs in this list. Every prevented breakdown is zero MTTR for that event. A well-run preventive maintenance program reduces the number of events your MTTR figure is averaged across — and eliminates the catastrophic failures (seized bearing, blown motor) that produce the 20-hour outliers that skew the average upward.
If there's one thing that consistently drives MTTR up in under-digitized factories, it's not slow technicians — it's missing access. The right part isn't findable, or the fault history isn't reachable at the machine when it's needed. Give technicians accessible tools and information at the point of repair, and MTTR drops without spending a dollar on capital.
MTTR vs MTTF vs MTTD
Three acronyms that appear in the same discussions. Each measures something different.
MTTF — Mean Time To Failure is used for non-repairable components: the average lifespan of a fuse, a lamp, a single-use filter, before it is replaced (not repaired). MTTF belongs in component specification and purchasing decisions. It is not a day-to-day maintenance management metric. Do not conflate it with MTBF, which applies to repairable assets.
MTTD — Mean Time To Detect is the average time between when a fault begins and when it is detected. In practice, most maintenance teams assume detection is instantaneous — the machine stops, the operator reports it, the breakdown clock starts. But a bearing running rough for four hours before anyone notices, or a hydraulic leak dripping for two shifts before it causes a pressure drop, represents real MTTD that gets silently folded into the MTTR figure. In plants with continuous monitoring (vibration sensors, temperature sensors), MTTD can be measured and managed explicitly. In plants without it, MTTD is an invisible contributor to high MTTR.
MTBF — Mean Time Between Failures is the metric that sits alongside MTTR as the other half of maintenance performance. Where MTTR measures how long recovery takes, MTBF measures how often recovery is needed. A full treatment of MTBF — formula, worked example, and how to interpret it — is in the MTBF guide. The relationship between the two metrics, and what different MTTR/MTBF combinations tell you about an asset's health, is covered in the MTTR vs MTBF comparison.
What is a good MTTR?
The honest answer is: it depends entirely on the machine, the industry, and the nature of typical failures — and anyone quoting a universal benchmark is making a number up.
A CNC machining center with complex electronics and long tool-change sequences will have a structurally different MTTR than a conveyor drive or a pneumatic cylinder. A foundry will have different failure modes than a food packaging plant. A machine whose typical failure is a bearing replacement will have a different baseline MTTR than one whose typical failure is an electrical fault requiring specialist diagnosis.
What is meaningful is your MTTR trend for a specific machine over time. Is it going down? Staying flat? Drifting up? And how does your MTTR for one machine compare to another machine of the same type in your plant — if one press consistently repairs in 2 hours and an identical press consistently repairs in 6 hours, that gap is worth investigating.
Benchmarking MTTR against industry averages from a published report is largely a distraction. Benchmarking your own machine against its own history is where the signal is.
Where MachDatum fits: MTTR per asset updates automatically with every closed work order — no spreadsheet, no manual calculation. When a technician arrives at a machine, the full work-order history for that asset is visible: previous faults, diagnoses, parts used, and how long prior repairs took. Root cause is a required field before a repair can close, so the data that drives MTTR improvement — fixing the process, not just the machine — is captured live, at the moment of repair, not reconstructed at month-end. Escalation rules surface breakdowns that have been open too long before the shift ends. We're onboarding our first group of manufacturing teams right now — see how it works.