




Machine downtime is any period during which a machine is not running when it was scheduled to be producing. It divides into two kinds: planned downtime — scheduled maintenance, changeovers, planned breaks — and unplanned downtime, the breakdowns and failures that stop production without warning. When a plant says it has a downtime problem, it means the second kind.
That distinction is the whole subject. Planned downtime is a decision; unplanned downtime is a surprise. The goal of tracking downtime is not to eliminate every stop — some are necessary and some are deliberate — but to see the unplanned ones clearly enough to reduce them.
What counts as machine downtime
A machine is either producing or it is not. Downtime is all the time in the "not" column that falls inside the window when the machine was supposed to be producing. Two machines can each be idle for the same eight hours, and one of those idles counts as downtime while the other does not — because one machine was scheduled to run and the other was not.
That is why the scheduled window matters more than the clock. A machine that is switched off over the weekend because there is no shift running is not accumulating downtime. The same machine stopped for two hours during a production shift is.
Uptime vs downtime
Uptime and downtime are two halves of the same scheduled window. Uptime is the portion of planned operating time the machine was available and running; downtime is the portion it was stopped. As percentages of planned operating time, they add to 100%. Uptime is the figure you want high. Downtime is the figure you track, because downtime is where the causes are.
Another word for downtime
You will hear machine downtime called a stoppage, an outage, idle time, or non-productive time. In an OEE (Overall Equipment Effectiveness) framework it appears as availability loss. On the floor it is usually just a breakdown or a stop. The vocabulary varies; what matters is that your team applies the same categories to the same events every time. Inconsistent labelling is the fastest way to make a downtime log useless.
What causes machine downtime
Downtime has a small number of recurring causes. Categorising every stop into one of them is what turns a log into a diagnosis.
- Breakdowns and failures — a component fails and the machine stops until it is repaired. This is unplanned downtime, and it is usually where the largest losses sit.
- Changeovers and setup — switching a machine from one product, tool, or die to another. Planned, but often longer than it needs to be, which is why changeover reduction (SMED and similar) is a discipline of its own.
- Material starvation — the machine is fine but has nothing to run: upstream supply stopped, the previous stage is behind, a component didn't arrive. The stop shows on this machine but the cause is elsewhere.
- Operator availability — no one is present to run or reset the machine. Shift gaps, breaks, someone pulled onto another line.
- Planned maintenance — scheduled PMs, inspections, lubrication rounds. Necessary downtime, and the cheapest kind, because it prevents the expensive kind.
The value of the categories is comparative. A plant losing most of its hours to changeovers has a very different problem — and a very different fix — from one losing them to breakdowns. You cannot see that difference until every stop carries a reason.
How to calculate machine downtime
The formula is simple, and stating it clearly is the single most useful thing this page can do — because "machine downtime formula" is one of the most common searches on this topic, and most articles never actually give it.
Downtime % = (Downtime hours ÷ Planned operating hours) × 100
The denominator is what people get wrong. It is planned operating hours — the time the machine was scheduled to run — not calendar hours, and not the full 168 hours in a week. If you divide by calendar time, a machine that only runs one shift will always look like it has enormous downtime, which tells you nothing.
A worked shift example
A machine is scheduled to run two 8-hour shifts a day, five days a week: 80 planned operating hours in the week.
During that week it was stopped for:
| Stop | Cause | Duration |
|---|---|---|
| Mon | Bearing failure | 2 hr 30 min |
| Tue | Die changeover | 1 hr 00 min |
| Thu | Waiting on material | 0 hr 45 min |
| Fri | Sensor fault | 0 hr 45 min |
| Total | 5 hr 00 min |
Downtime = (5 ÷ 80) × 100 = 6.25%
So uptime that week was 93.75%. But the more useful reading is underneath the percentage: of the five hours lost, 3 hours 15 minutes were unplanned (the bearing and sensor failures, plus the material wait), and one hour was a planned changeover. The single figure — 6.25% — is the headline. The split by cause is what you act on.
This is the difference between measuring downtime and understanding it. The percentage tells you how much. The reason codes tell you what to fix.
What machine downtime actually costs
This is where most content on the subject goes wrong, so it is worth being careful.
You will see a figure repeated across nearly every article on machine downtime: that an hour of downtime costs, on average, $260,000. It appears with an air of authority and almost never with a source. When you follow it back, it comes from an Aberdeen Group report published in February 2016 — titled Maintaining Virtual System Uptime in Today's Transforming IT Infrastructure. It is a study of IT and server infrastructure uptime, across all industries. It is not about manufacturing machines, and it is now the better part of a decade old. It has simply been copied from one blog to the next until the original subject was lost.
Do not budget with it. It is not a manufacturing number.
The most credible recent figure comes from Siemens' True Cost of Downtime 2024, which put unplanned downtime at around 11% of annual revenue for large manufacturers — but with an important qualifier that is usually dropped: the study measures Fortune Global 500 industrial companies. That is a useful headline for the scale of the problem industry-wide. It is not a benchmark you can apply to a 200-person plant, and anyone who quotes it as one is misusing it.
The honest approach is to calculate your own cost, because it is not hard and the result is defensible:
Cost of an hour of downtime ≈ (units lost per hour × contribution margin per unit) + labour idled + scrap + expediting
If a line produces 400 units an hour at a contribution margin of $6 a unit, an hour of downtime costs at least $2,400 in lost margin — before you add the operators standing idle, any scrap from the stop and restart, and the cost of expediting to catch up. That number belongs to your plant. A borrowed benchmark belongs to no one.
Tracking downtime without buying anything yet
Most downtime content moves straight from "downtime is expensive" to "so buy our sensors." The honest first step is cheaper than that, and for a lot of plants it is the step they have actually skipped.
Before any hardware, a downtime log needs five things: machine, stop time, restart time, duration, and reason code. Duration should be a formula, never typed by hand. Reason codes should come from a fixed dropdown — a short, closed list — so the same fault is always labelled the same way. A pivot table over that log gives you downtime by machine and by reason, which is 80% of the insight a six-figure monitoring platform will sell you.
A spreadsheet that does this well is a genuinely good tool. It is where most plants should start, and there is no shame in it.
It breaks down at one specific point: when logging depends on someone remembering to fill it in after the shift. Under production pressure, the spreadsheet is the first thing that gets skipped, and a downtime log with holes in it is worse than none — because it looks like data while quietly under-counting exactly the stops that mattered most. That is the point — not a sensor budget, not a headcount — where downtime capture needs to stop being a separate task and start being part of the repair itself.
Downtime as a maintenance record, not just a production metric
Here is the reframe that most of the field misses. Nearly every article treats machine downtime as something a sensor or an MES captures off the line — a production number, generated automatically, reviewed by a plant manager.
But every unplanned stop is also a repair. Something failed, someone fixed it, and the machine came back. If the downtime is recorded at the moment that repair closes — with the cause, the failure mode, and the work order attached — then the downtime figure and the maintenance history become the same record. You are not running a separate downtime-tracking exercise alongside maintenance; downtime falls out of the maintenance work you are already doing.
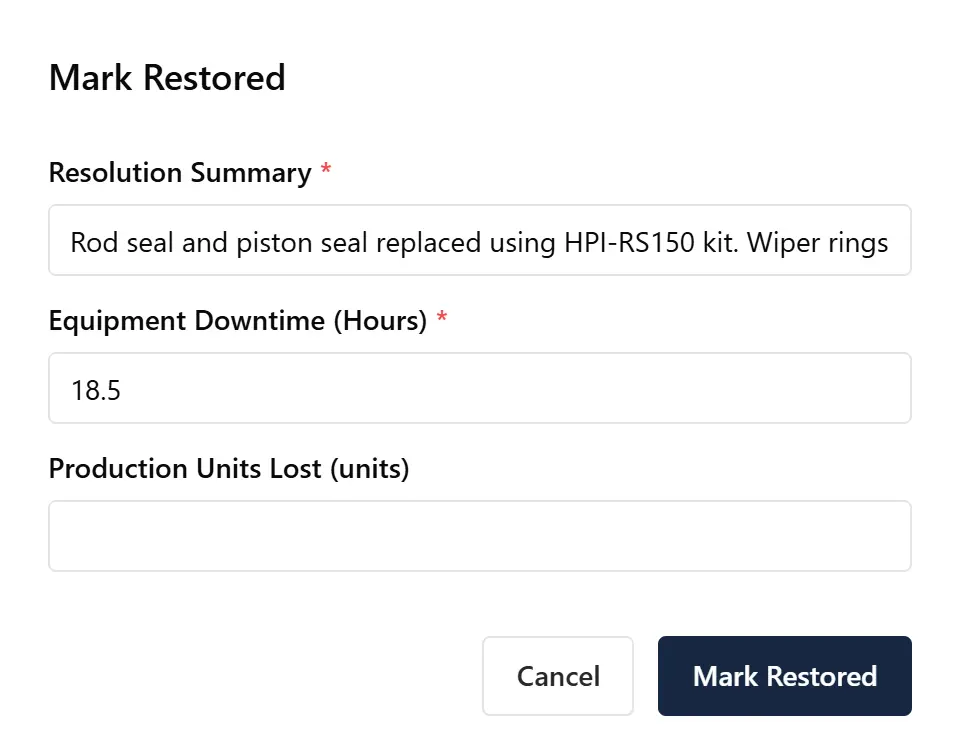
This is why the recording problem matters more than the measurement problem. A plant that cannot answer "how many hours did we lose last month, and to what?" does not, in most cases, have a sensor problem. It has a recording problem — the stops happened, the repairs happened, but nothing captured them in a form you can total and sort. Sensors add resolution to a record that already exists. They do not create the record. That is why measure before you buy is not a slogan here — it is the cheaper, faster first move, and it is the one that gets skipped.
How downtime connects to MTTR and MTBF
Downtime percentage tells you how much time you lost. It does not tell you whether you lost it to a few long stops or many short ones — and that distinction changes what you do about it. Two metrics separate the two:
- MTBF — Mean Time Between Failures measures how often a machine fails. Falling MTBF means breakdowns are getting more frequent.
- MTTR — Mean Time To Repair measures how long each recovery takes. High MTTR means each stop keeps the machine down for a long time.
A machine can rack up the same downtime hours two very different ways: frequent short failures (low MTBF, low MTTR) or rare long ones (high MTBF, high MTTR). The fixes are opposite — one is a reliability problem, the other a response problem. Downtime is the symptom; MTBF and MTTR are the diagnosis. The MTTR vs MTBF guide covers how to read the two together, and the maintenance KPIs guide shows where downtime sits in the wider metric set.
How to reduce machine downtime
Reducing downtime follows from measuring it honestly. In order:
- Record every stop with a cause. You cannot reduce what you are not counting. This is the step, above — and it is free.
- Sort by cause and attack the biggest. A Pareto view almost always shows a small number of causes producing most of the lost hours. Fix those first; ignore the long tail until they are done.
- Convert recurring breakdowns into preventive maintenance. If the same failure keeps appearing in the log, it belongs on a PM schedule, not in the breakdown queue. This is how downtime tracking feeds back into fewer breakdowns.
- Stock the parts your top failures need. Much of unplanned downtime is not repair time — it is waiting for a part. Stocking the wear parts for your highest-downtime machines is often the single highest-leverage move.
- Only then consider sensors. Once you know your losses by machine and cause, you can tell whether automatic, second-level stop detection would actually buy you anything the log isn't already giving you. For most under-digitised plants, it wouldn't — yet.
For the software category specifically — sensor-based platforms versus work-order-based capture, what to look for, and honest signs you don't need hardware yet — see the downtime tracking software guide.
Where MachDatum fits: Downtime hours and root cause are required fields when a breakdown work order closes — so the downtime log and the maintenance history are one record, captured at the machine, not reconstructed from memory at month-end. Downtime totals by machine and by reason update automatically with every closed work order, and the same data drives MTTR and MTBF per asset without a separate spreadsheet. No sensors required to start. We're onboarding our first group of manufacturing teams right now — see how it works.